THE DIRTY SECRET OF THE PHOTOVOLTAIC INDUSTRY: "CARBON INTENSITY" JUNK SCIENCE
Guest Author: @enricomariutti
Energy Economists Understand Objective Reality
One of the most meaningful benefits of #EnergyTwitter is meeting people who understand how Civilization really works. @enricomariutti is an energy economist and consultant working in Rome.
Some time back, I invited him to write some articles to share his professional experience and knowledge, offering to republish his work on this Substack account. He took me up on this offer and recently sent me the following essay challenging the absurdity of energy “lifecycle assessments” used to justify Rube Goldberg Machines aka Wind and solar. This essay focuses on PV solar. It’s worth your time to read it. Enrico’s English is far better than my Italian. Here’s what he sent me:
Enrico Mariutti: Debunking “Carbon Intensity”
Photovoltaic energy has become the pillar of the global decarbonisation strategy because of two words: carbon intensity.
What is meant by the carbon intensity of energy? Carbon intensity is defined by the amount of CO2 emitted per unit of energy produced.
How is the carbon intensity of energy calculated?
In the case of fuels it is simple: you multiply the amount of energy produced by the burned fuel by its emission factor.
The cases of the energy produced by photovoltaic plants are a little more complicated since they do not burn anything (and thus do not emit any CO2) when the energy is produced. In this case, it is necessary to measure the CO2 emitted during the building of the plant (its so called carbon footprint) and divide it by the expected energy production at the plant over its life.
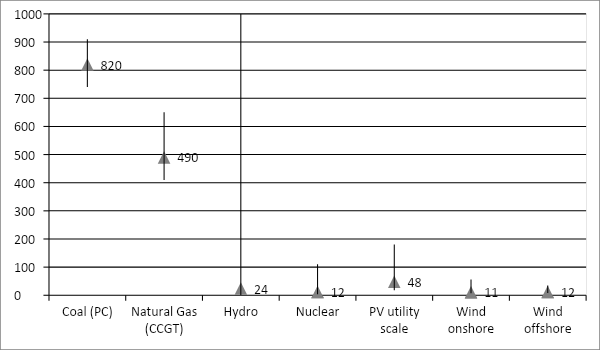
Given that the Intergovernmental Panel on Climate Change (IPCC), the International Energy Agency (IEA), the US National Renewable Energy Laboratory (NREL) and many other authorities attribute the carbon intensity of photovoltaic energy to be ten times lower than that of natural gas (Combined Cycle Gas Turbine, CCGT) and twenty times lower than that of coal (Pulverized Coal, PC), it seems natural that photovoltaic energy should be the mainstay of most decarbonisation initiatives.
Carbon intensity of energy
Median values, gCO2/kWh
There is only one problem: these estimates are all built on the same studies and cite data that no authority with supervisory powers has ever validated, and are based on scenarios that are incompatible with the reality of the global photovoltaic industry.
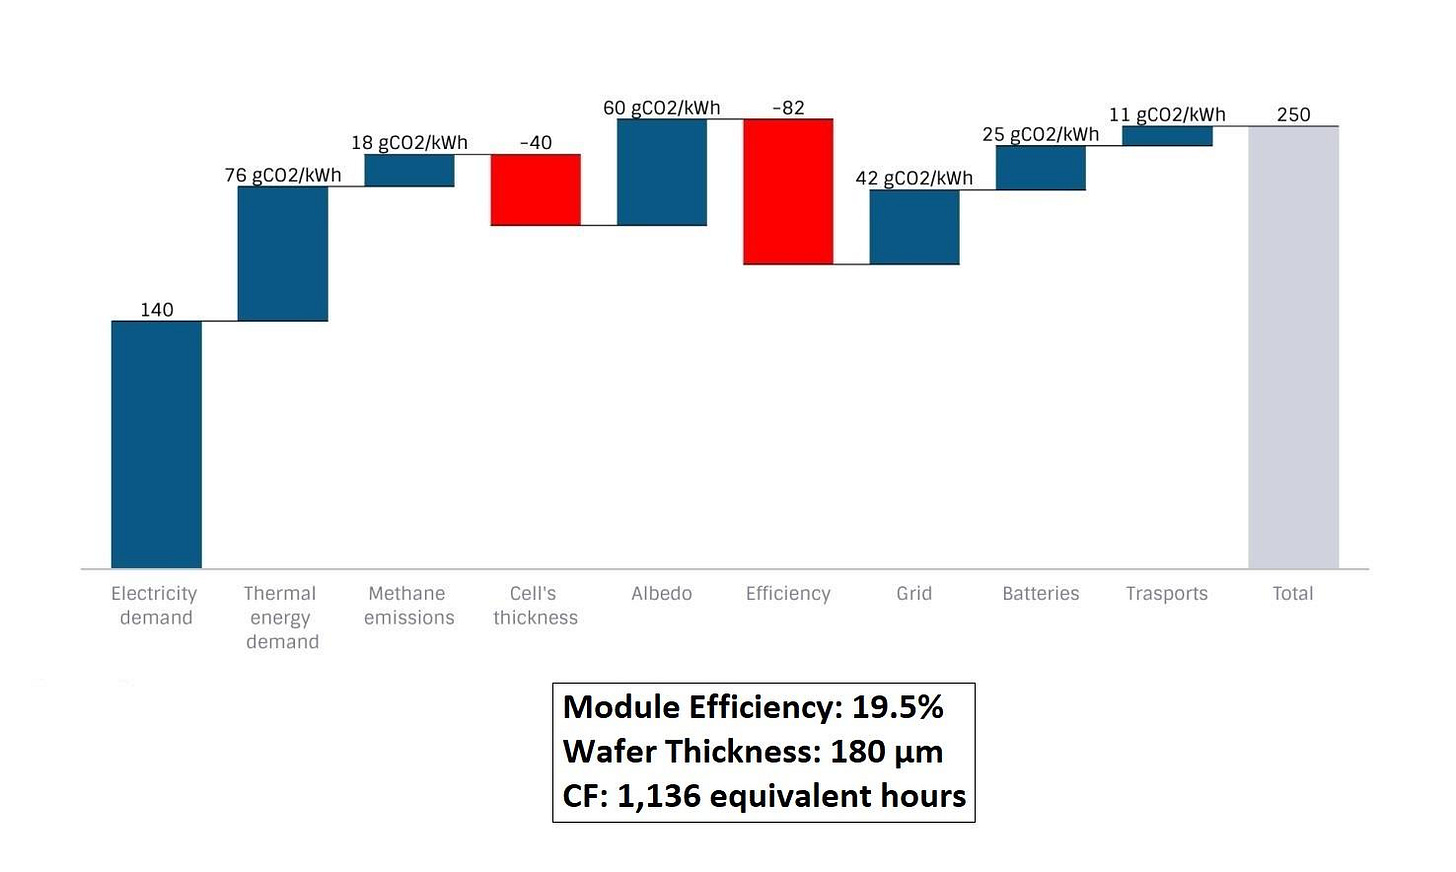
If we imagine a scenario where the photovoltaic system is manufactured in China and subsequently installed in Italy, the carbon intensity of photovoltaic energy can be more than 200 gCO2/kWh.
The real carbon intensity of PV energy
PV system manufactured in China and installed in Italy
Sounds unbelievable? Let's see how the IPCC (and the NREL) calculates the carbon intensity of photovoltaic energy.
Let's start with the IPCC's fifth assessment report (A.R.5). This is an outdated document, especially since the sixth assessment report (A.R.6) came out between 2021 and 2022, but it has considerable political importance. This is due to the fact that the Paris Agreement was drafted on the basis of the scientific evidence presented in the A.R.5.
The estimated carbon intensity of photovoltaic energy (crystalline modules) is based on a single review of thirteen papers by Hsu et al. (2012). Seven of the thirteen studies base their estimate of the carbon intensity of photovoltaic energy on scenarios where modules are manufactured in Europe, with a short supply chain, and relying on a low-carbon energy mix (hydropower, natural gas, European grid electricity, waste heat) for production.
Since the IPCC extrapolates a median figure from the review, this methodological choice seriously distorts the estimated carbon intensity and Energy Return on Energy Investment (ERoEI).
The same review frames the impact of the composition of the energy mix on the estimate of carbon intensity. Among the reviewed studies, there is one that bases its estimates on the Swiss energy mix (which is dominated by hydropower) and one on the Australian energy mix (which at the time was dominated by coal). In the first case the solar irradiation is about half that of the second. The inventory of materials and industrial processes is the same in both studies. Yet the study analysing the Australian scenario arrives at a carbon intensity estimate that is four times greater than that found in the study analysing the Swiss scenario.
PV energy carbon intensity as a function of the underlying energy mix
gCO2/kWh
I asked Garvin Heath, Senior Environmental Scientist and Energy Analyst at NREL, Operating Agent in several IEA reports, and co-author of Hsu et al. 2012, how he explained the difference between this value and the median result reported in the review (about 40 gCO2/kWh). He replied "Don't know".
The choice of an energy mix so far removed from reality, however, is only one of the problematic aspects in the thirteen studies on which the global decarbonisation strategy is based.
Some of these studies calculate the carbon intensity of photovoltaic energy by only counting the emissions related to the manufacture of the module, as if the solar panels were floating in air. Others do not include the so-called Balance of Systems (inverters, transformers, etc.), even though a photovoltaic system cannot works without them. None of the studies include the increase in carbon footprint associated with grid upgrades, despite this being a widely discussed topic. None of the studies include the albedo effect, despite it being a well-known climate forcing, just like CO2 is.
It is also worth noting that in 2023, the NREL still bases its estimate of the carbon intensity of photovoltaic energy on the results of Hsu et al. 2012, as Mr Heath confirmed to me.
In A.R.6 (Vol. III, Chapter VI, April 2022), things become more nuanced. On one hand, when referring to the carbon intensity of photovoltaic energy, the authors state: "GHG LCA estimates span a considerable range of 9-250 gCO2/kWh", effectively contradicting the estimates in circulation, which routinely refer to a range of 20-40 gCO2/kWh.
But they then add: "recent studies that reflect higher efficiencies and manufacturing improvements find lower life-cycle emissions, including a range of 18-60 gCO2 kWh and central estimates of 80 gCO2 kWh, 50 gCO2 kWh and 20 gCO2 kWh”.
To support these recently improved estimates, the IPCC authors attach four studies: two analyse (on the basis of a confidential inventory) the life cycle emissions of photovoltaic modules manufactured in Europe with a low-carbon energy mix. The inventory is the same because one study uses the other as a source (using papers that cite each other as sources in a review is usually considered predatory journal practice);
the third analyses the life-cycle emissions of a photovoltaic panel made from Uprgraded Metallurgical Grade Silicon cells (UMG-Si), despite the fact that there are currently no photovoltaic cells made from UMG-Si on the market; the fourth is a review of sixteen studies that for the most part analysed the life-cycle emissions of panels manufactured in Europe from a low-carbon energy mix (in short, the same database on which the A.R.5 estimates were made).
I asked the authors of the chapter about these concerns. Some replied, telling me to address these questions to the leading author, Leon Clarke. I tried to contact him many times but he never replied.
For completeness, I also analyzed the IEA PVPS Task 12 “Life Cycle inventories and life cycle assessments of photovoltaic systems” (2020), as recommended by Marco Raugei, co-author of numerous institutional reports in this field.
Again, several contradictions are apparent. The IEA report lists the inventory of materials and industrial processes involved in the construction of a photovoltaic plant, but does not report estimates of either the carbon footprint or the carbon intensity.
By cross-referencing the IEA inventory with data from International Alluminium, World Steel, and Ecoinvent, it is evident that the carbon footprint of a photovoltaic system made in China is clearly - clearly - higher than that estimated by the IEA itself in other reports.
In conclusion, we are basing an environmental strategy that costs trillions of dollars on studies that not even their authors feel like defending. In fact, when I asked the authors about the idiosyncrasies in their studies, most of them answered that this was the "best data available".
Is this normal?


Backup needs to be included in the carbon footprint and intensity calculations. How much backup? As much as seven weeks. At today's prices, for an all-electric American economy with an appetite for 1.7 TWe, the cost would be about NINE TIMES TOTAL GDP EVERY YEAR!
http://vandyke.mynetgear.com/Worse.html. https://vsnyder.substack.com.
Thanks very much, Enrico. I haven't seen this laid out clearly anywhere else.
Are you able to estimate the carbon content of Chinese PV other than "much more"? Is much of the polysilicon production driven by coal (as I've seen a number of places) or by LNG, per Doomberg today?